
Once you have gathered your data, it can sometimes be overwhelming deciding what to do next. This bite will guide you through steps to help you come to a decision of what statistical analysis to run for your data set.
Planning your statistical analysis
With a large collection of statistical tests to choose from, it is important to know what statistical test you are going to run before collecting your data. Not only will this help you avoid poor research practices, the type of test you run is directly related to the design of your study and the data you collect. Therefore planning your statistical test has a number of benefits such as:
- It will help you to plan your research and data collection
- You will save time and effort because only relevant data will be collected
- You will gain a deeper understanding of the statistical tests you are using, enabling you to better interpret your results
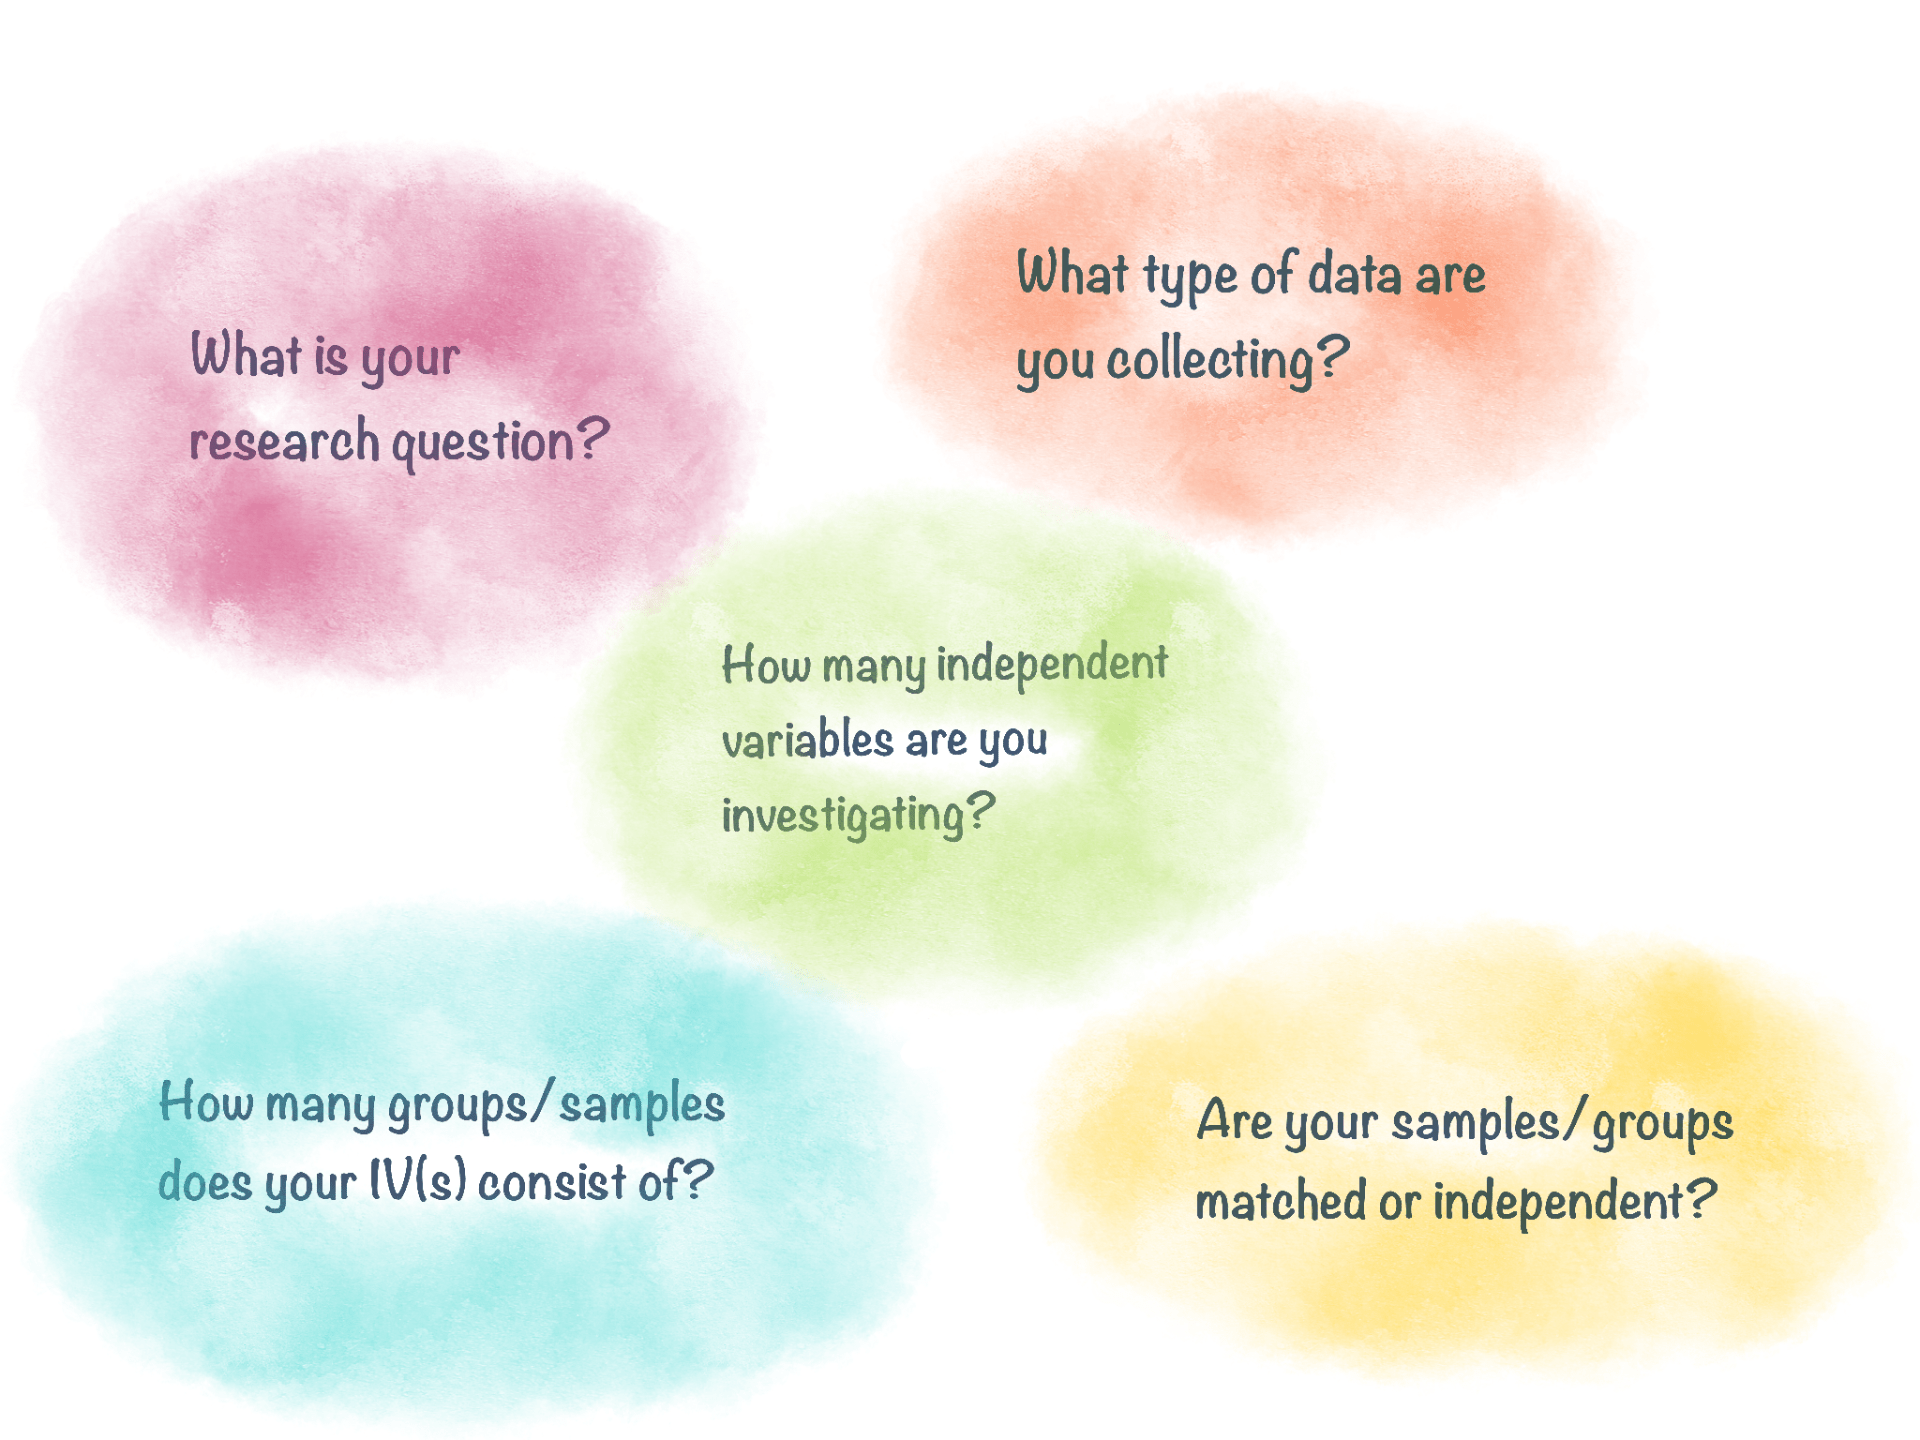
What is your research question?
Probably one of the most important questions to ask yourself is what is it that you are trying to find out by performing a statistical test. Are you looking for evidence of differences between groups? Are you looking for a relationship? Are you interested in whether one variable can predict a particular outcome? The statistical test needs to be able to answer your research question. It may be that there is more than one option that produces equally legitimate results. If this is the case, find out more about the test, its advantages and disadvantages, how they correspond with your research question and data to come to a decision.
Below are a few examples of different research questions and statistical analyses you might consider.
Q1. “Is there a difference in maths test scores when students practice 1 hour of meditation before the test compared to student who don’t?”
This research question is looking for a difference between two groups. For this reason, you may choose to run a t-test, which is designed to compare the-means of two groups. Similarly, if the assumptions for this test are not met, you could run the non-parametric equivalent Mann-Whitney-U test, which compares the medians instead.
Q2. “Is there a relationship between industrial regions and instances of lung cancer?”
This research question is looking for a relationship between two variables (industrial regions and lung cancer) therefore you would want to run a type of correlation analysis such as Pearson’s correlation. Similarly, if the assumptions for this test are not met, you could run the non-parametric equivalent Spearman’s correlation.
Q3. “Can the number of hours of exercise per week predict one’s level of life satisfaction?”
This research questions asks whether one variable can predict another. For this, you would need regression analysis, which goes beyond just finding a relationship, but can tell you how much life satisfaction changes in relation to a change in exercise.
What type of data do you have?
What type of data are you working with? For example, are your variables categorical (also referred to as qualitative) or numerical (also referred to as quantitative)? Following this, what is the level of measurement of your variables? Are they discrete or continuous? Ordinal or nominal? Interval or ratio? The type of variables you are investigating are important to consider when choosing a statistical test. Many tests are only compatible with certain types of data, therefore choosing an incompatible test will produce meaningless results. Data types in statistics can be confusing at times, particularly due to the interchangeable terms. The following video provides a brief explanation of the data types with relevant examples If you would like a more in-depth explanation with more examples, please refer to this short online post.
What is the design of your research?
The statistical analysis you choose needs to accommodate the design of your study. If your research is experimental, you will need to consider whether your study is a repeated measures design, sometimes called ‘within groups’ or ‘dependent’ design, or whether your study is an independent measures design, sometimes called a ‘between groups’ design. Additionally, several tests are only compatible when dealing with a certain number of variables with a certain number of groups/samples. It is a good idea to note what your variables are and how many samples they will consist of. Following from the previous step, it is also a good idea to note beside each variable, the type of data it is comprised of. The following web page provides a really useful table which summarizes the suggested test to use depending on the nature of your data and variables
Does your data satisfy the assumptions of your chosen analysis?
Always make sure that your data meets the criteria of your chosen analysis. Statistical analysis that is based on assumptions that are incorrect is likely to result in conclusions that are also incorrect. Here is a very informative pdf that demonstrates the underlying assumptions of each test, how to check these assumptions and what to do when these assumptions are violated. It also provides information on several statistical concepts that are useful to understand.
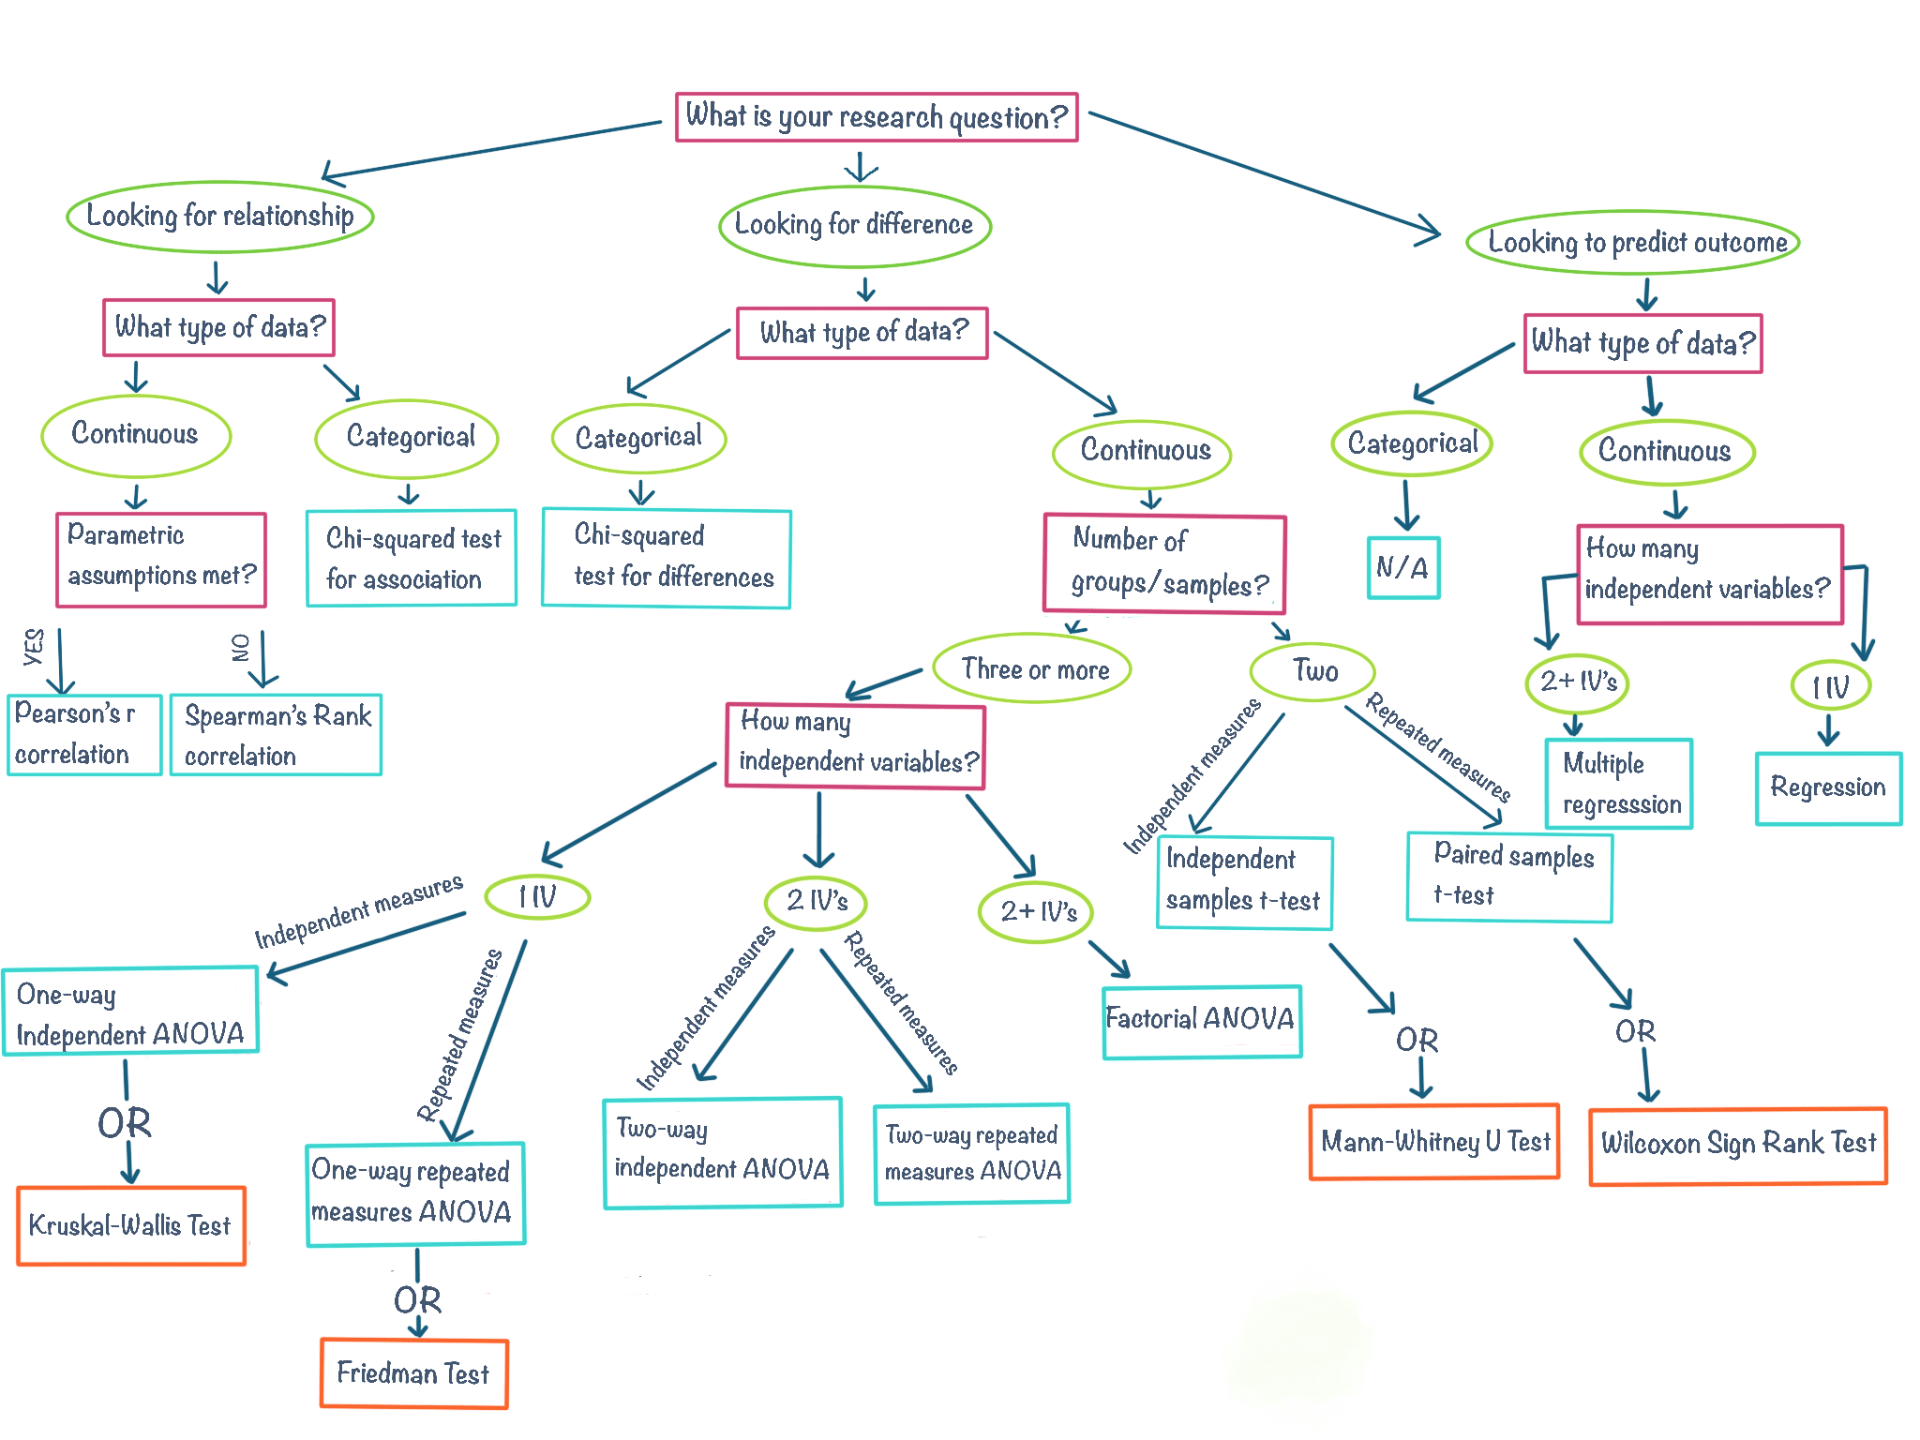
The following flow chart will help guide you to the most appropriate statistical test based on your answers to the above questions. Remember, this is just a general guide and therefore may not cover the complexity of your data set. If you are still unsure, it is best to have a discussion with your tutor or supervisor
…Still needing a little help?
Haven’t found what you were looking for? Try browsing some of the other online resources on the home page. Additionally, you can get one-to-one support by contacting your tutor or attending one of the Math Base drop-ins held regularly throughout semester.