Summary
- Taking a look at some examples of different types of media.
- Useful resources and software for creating your content.
Infographics
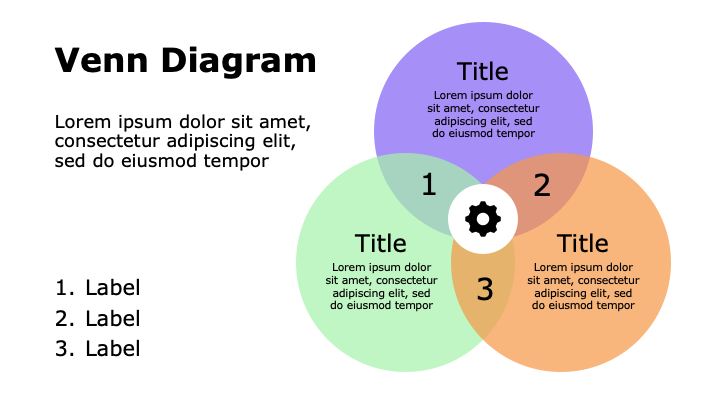
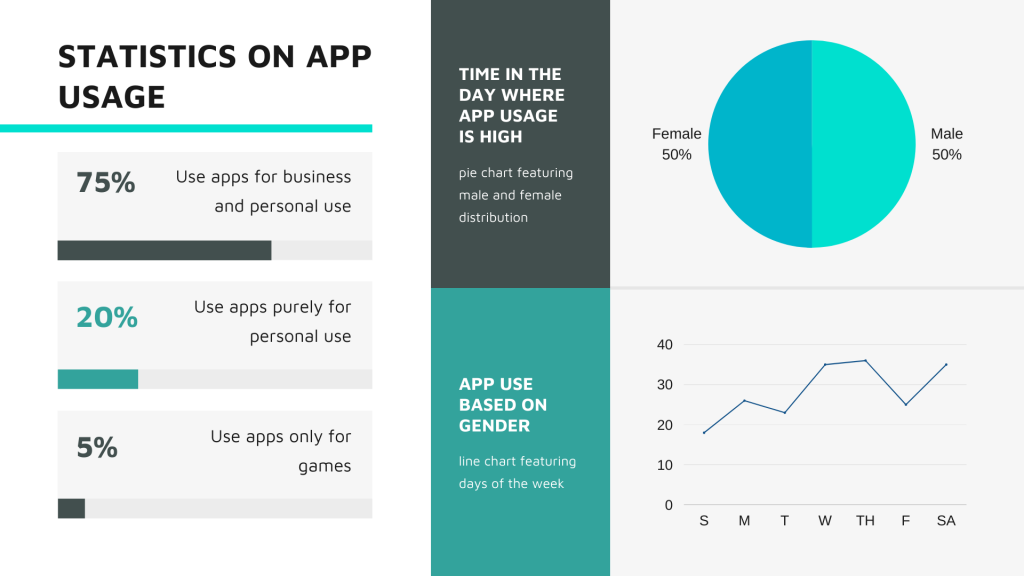
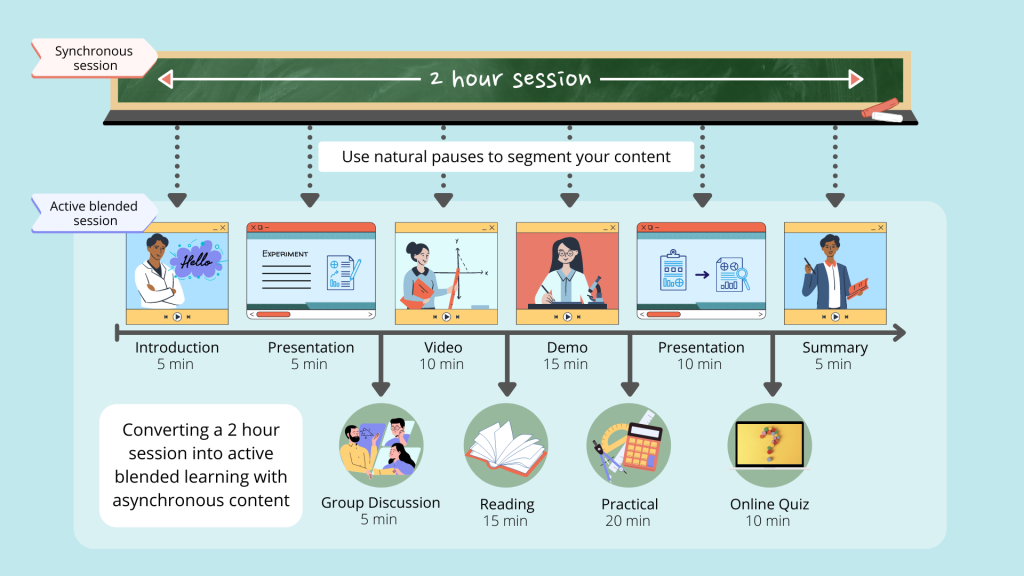
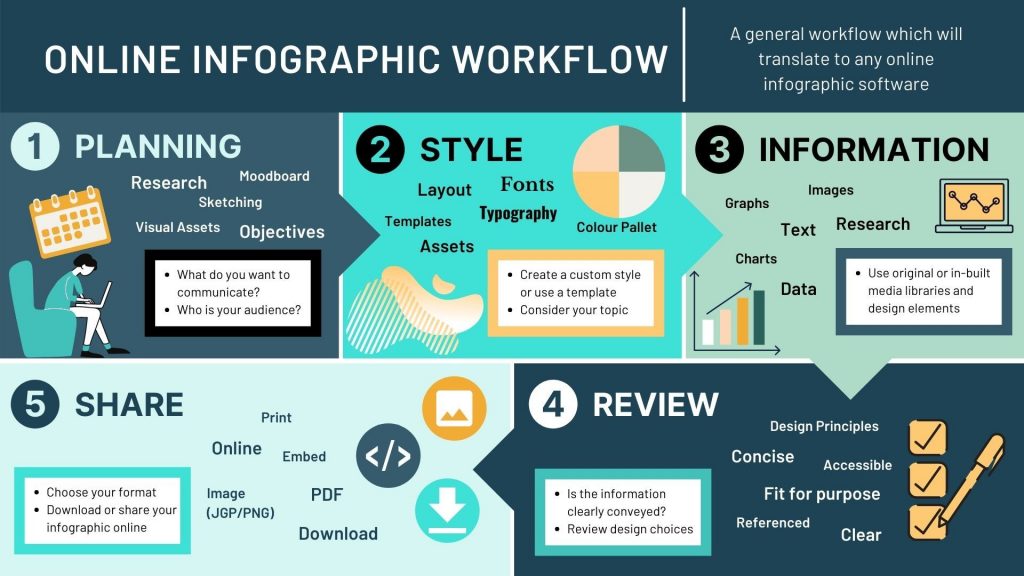
An infographic can be described as a visual representation of information or data. This may be in the form of an infographic poster or an image within a presentation, for example. Infographics can work really well to explain processes or to simply complex data into something visual (this is also known as data visualisation).
Using infographics
Below are some ways you may wish to use an infographic. Can you think of any more?
- A visual overview of weekly activities in a module
- Represent results of an experiment
- Simplify a complex set of instructions
- Graphical abstract for a paper
Infographics – Software and Resources
Using MS office, you will find that you can use basic shapes, icons and charts to create infographics for your content. This video by Educational Technologist, James Kieft shows you how to create an infographic in PowerPoint.
There are also many infographic software websites available online including Canva (sign-up required) and Adobe Spark (sign-in with staff email address). These sites offer you a range of templates, in-built tools and media to help you get creative.
- Introduction Infographic Workshop: Using Adobe Spark and Canva, 30 mins – Workshop recording (available to University of Dundee staff only).
- Canva and My Dundee , 1 min – Video of how to embed an infographic made with Canva into a My Dundee document.
- Image use rights: Adobe Spark, Canva
Presentations
We have used presentation slides as examples throughout this Learning X series. In summary, when designing your presentation slides you should consider:
- Consistency, such as the colours used or the placement of headings
- Visual hierarchy and layout
- The balance between text and graphic elements
- Sufficient negative space and consistent margins
- Significant contrast between colours (particularly text and background)
- Simple, clear typefaces and fonts
Design and Accessibility for PowerPoint
PowerPoint Video 1 – Improving Design Accessibility
PowerPoint Video 2 – Accessibility Checker
Presentations – Software and Resources
- Presentation and Learning Design – tutorial by Iona Campbell; Natalie Lafferty; Annalisa Manca
- PowerPoint: Design your Slides – Microsoft Support
- PowerPoint: Pictures, charts and tables – Microsoft Support
Video
Check out our Learning X series on Effective Videos for Education for more information!
- Planning
- Engagement and delivery style
- Video ready teaching materials
- Recording video for education
- Editing video for education
- Summary and references
Accessibility
It is worth thinking about files in which your audience cannot easily edit the formatting (for example, a video or PDF). If you provide an additional copy of the original file (for example, a PowerPoint presentation) the text, the colours and the design can be customised by the audience to meet any specific needs they have. Text can be increased in size or the colours changes for any visual or neurological needs. It is still important to keep to professional standards and use a design that is accessible as possible from the get-go.
Activity
Steppingstone – Day 6: Finalise your Visuals
By now you should have made some progress with your design and have hopefully started to think about developing your visual style. The next stepping stone is to ‘finalise your visuals’. This will be dependent on the type of content you are creating. It may be creating slides for a pre-recorded lecture or adding text / images to an infographic.
Today’s is mainly about research and discussion. Let us know how you have been getting on so far in the comments. Please reach out with any questions you may have.
